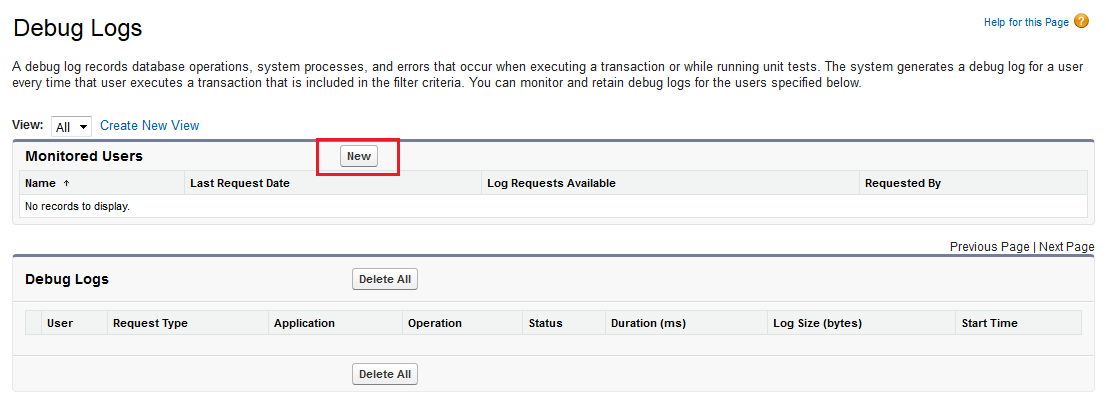
A debug log records database operations, system processes, and errors that occur when executing a transaction or while running unit tests. The system generates a debug log for a user every time that user executes a transaction that is included in the filter criteria. We can monitor specific users in Debug log by adding them to list of Monitored Users.
Add Users to the debug log:
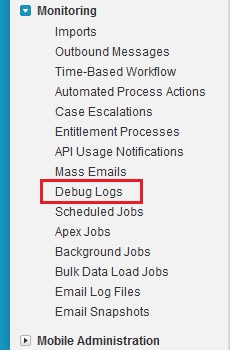
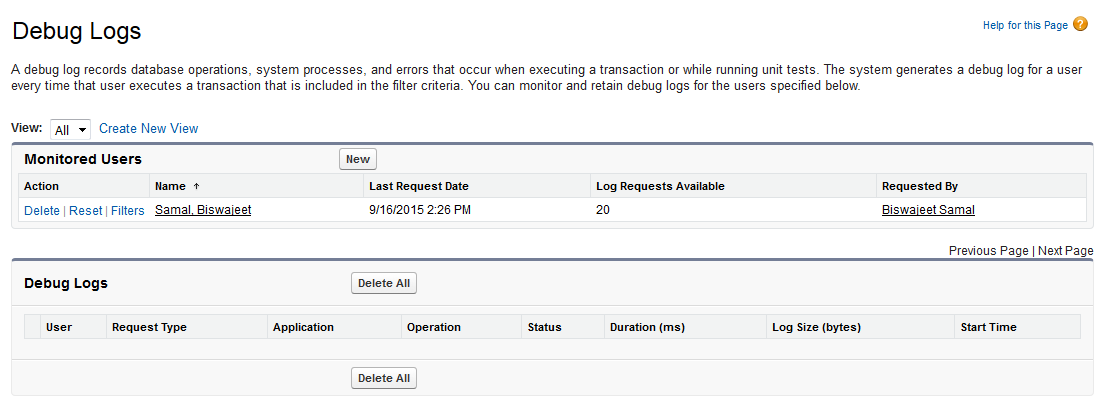
Step1: Go to Setup, click Monitoring | Debug Logs.
Step2: Click on New button to add User.
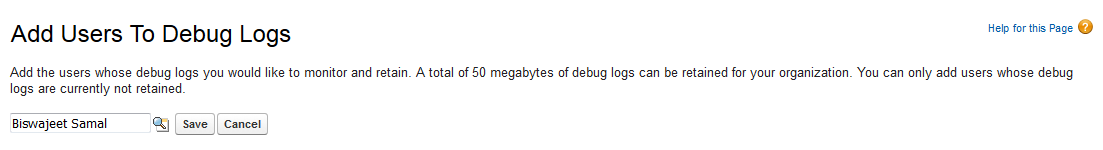
Step3: Add User and Save.
Debug log can contain information about:
- Database changes
- HTTP callouts
- Apex errors
- Resources used by Apex
- Automated workflow process, such as :
- Workflow rules
- Assignment rules
- Approval processes
- Validation rules
Debug Log Categories:
We can specify the following log categories. The amount of information logged for each category depends on the log level:
| Log Category | Description |
| Database | Includes information about database activity, including every data manipulation language (DML) statement or inline SOQL or SOSL query. |
| Workflow | Includes information for workflow rules, flows, and processes, such as the rule name, the actions taken, and so on. |
| Validation | Includes information about validation rules, such as the name of the rule, whether the rule evaluated true or false, and so on. |
| Callout | Includes the request-response XML that the server is sending and receiving from an external Web service. This is useful when debugging issues related to using Force.com Web services API calls. |
| Apex Code | Includes information about Apex code and can include information such as log messages generated by DML statements, inline SOQL or SOSL queries, the start and completion of any triggers, and the start and completion of any test method, and so on. |
| Apex Profiling | Includes cumulative profiling information, such as the limits for your namespace, the number of emails sent, and so on. |
| Visualforce | Includes information about Visualforce events, including serialization and deserialization of the view state or the evaluation of a formula field in a Visualforce page. |
| System | Includes information about calls to all system methods such as the System.debug method. |
Debug Log Levels:
We can specify the following log levels.
- ERROR
- WARN
- INFO
- DEBUG
- FINE
- FINER
- FINEST
Note: The following are the limits for debug logs:
- Once a user is added, that user can record up to 20 debug logs. After a user reaches this limit, debug logs stop being recorded for that user. Click Reset on the Monitoring Debug logs page to reset the number of logs for that user back to 20. Any existing logs are not overwritten.
- Each debug log can only be 2 MB. Debug logs that are larger than 2 MB are reduced in size by removing older log lines, such as log lines for earlier System.debug statements. The log lines can be removed from any location, not just the start of the debug log.
- Each organization can retain up to 50 MB of debug logs. Once your organization has reached 50 MB of debug logs, the oldest debug logs start being overwritten.
Example:
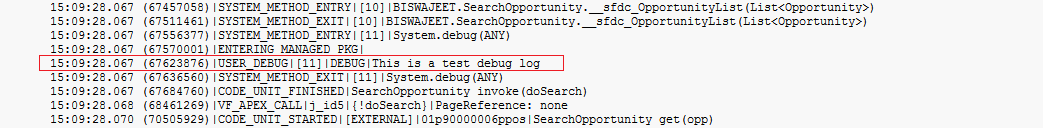
Here is a sample debug log I’ve written it in an Apex class, which is the controller of a visualforce page.
System.debug('This is a test debug log');
Now execute that visualforce page on which the code is written.
After execution again go to the Debug Logs page, where the user is added. You will see the screen like below:
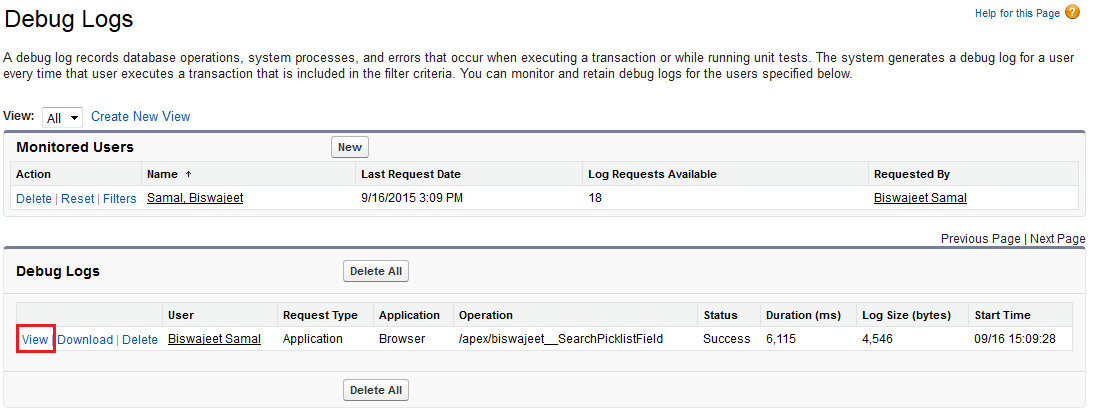
As you can see now that new row is added in “Debug Logs” section. click on the “view” button.